Want to read about the acceleration we are seeing in our society in the area of mobility? Read our new book ‘Forward’.
Updated June 9, 2020. Today, Tesla Motors published their 2019 Impact report. The report contains very interesting data about the environmental impact of their products. In the report, for the first time, there is also information on battery degradation. This is the relevant figure:
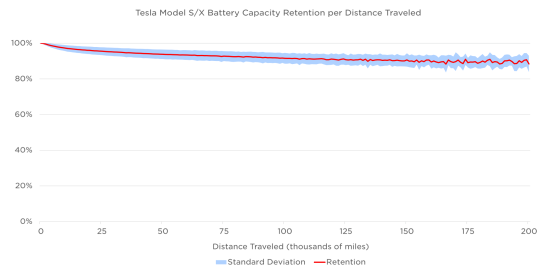
The figure shows a similar behavior as our user findings shown below: a fast decay the first 25,000 miles (40.000 km), of about 5%, and then a slow decay of apps. 7% in 175,000 miles or 281.000 km. This slow decay is then typically, on average, 1% per 25,000 miles or 1% per 40.000 km. The numbers do not go beyond 200,000 miles, and we do not know if the linear behavior will stay for high milages. However, this is the region beyond the normal lifespan of cars.
Updated: May 5, 2020. Tesla Motors provides an 8-year infinite mile battery failure warranty but it doesn’t cover degradation. Therefore it is highly relevant for every Tesla driver to know what to expect of the degradation of the capacity over time, because it is equivalent to the range of your car. In the Netherlands, Merijn Coumans started this survey via the Dutch-Belgium Tesla Forum in 2014, with a file of owners’ data, now organized by TroyTeslike. Detailed explanations are also in the google doc file, as well as at the end of this blogpost. You can add your own data as well. See also the website of TroyTeslike. The most recent (May 5, 2020) version of the results is displayed below (miles).

In the figure the percentage of range loss is shown on the vertical axis. The horizontal axis displays the distance (in miles, max is 400.000 km) driven with the vehicles.
The red fitted line has a slope above 60.000 km (say 40,000 miles) of 1% per 50.000 km (30,000 miles). On average the batteries have 91% remaining at 270.000 km (170,000 miles). If the linear behavior would continue, then the ‘lifetime’ (still 80% capacity left) can be calculated as follows: 91-80 = 11% times 50.000 km = 550.000 km, plus 270.000 km, gives 820.000 km (510,000 miles)! Note that a ICE car has a average lifetime of 220.000 km (140,000 miles)… And remember: if an ICE fails after say 300.000 km, you have a problem. The battery in a Tesla EV after the suggested 820.000 km (ok, lets take 500.000 km, still great!) still has 80% capacity left!
To put in into perspective, on a 0-100% scale, it looks like this:

Here is a nice video introducing an interactive graph from Teslanomics
The way to measure this is to do a full charge (100%) and then check the EPA rated range (in North America) or Typical range (in Europe and Asia/Pacific). In the plot, these numbers are then compared to the range numbers the car displayed when it was new. For example, for the 85 kWh Model S85 variant, this is about 400 km typical range or 265 mi EPA rated range. Even though this is mostly a reliable method, sometimes the computer in the car can’t accurately estimate how much energy the battery holds and might display an inaccurate range number. To improve accuracy, it is a good idea to run down the battery to almost empty and then charge to 100%, once a month. This is known as rebalancing the battery. However, the battery shouldn’t be left at 0% or 100% for more than 2 hours.
Besides Mileage vs Remaining Range, the file includes two other charts: Charge Cycles vs Remaining Range and Battery Age vs Remaining Range. From literature and research we know typically that 80% of battery capacity remains after 1000-2000 full cycles, strongly dependent on the temperature of the batteries. The data below support these numbers.


Here is a recent update from the USA with almost 130000 miles driven as max.
 From the USA+ drivers I could find the following previous data of the Plug in America Survey, and used it to generate the following picture:

I compared all provided data with the EPA 265 miles number for the 85kWh Model S and to the 210 miles EPA number for the 60 kWh models. It is not clear of course how trustworthy this data is, and how peoples measured..
If you like the km version, here it is:

The plot below is from UK-manufactured Nissan Leafs, 2013 24kWh models, thanks to http://speakev.com forum users and via Simon Canfer.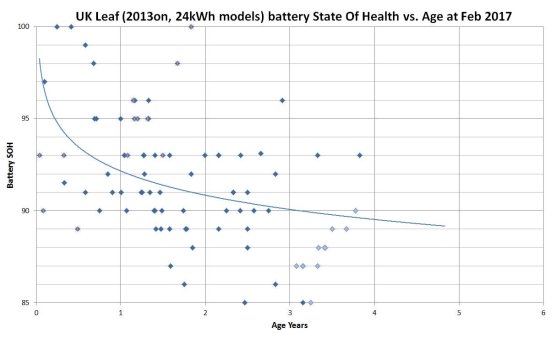
Links on battery degradation:
A nice video on battery degradation can be found here.
How to prolong Lithium-based batteries?
Some data from 2013 from the Tesla Forum
Here is a very nice report on the Tesla Roadster by Plug-in America, one result is the following one, based on 126 vehicles:

—–
here are some of the notes supporting the data at the top of this blogpost:
| Notes | |||||||
| ◘ These charts are updated every time there is a new entry. All charts on this page show entries from all locations. | |||||||
| ◘ The trendlines are generated by the chart. Hover over the trendline to see the current formula. | |||||||
| ◘ When range mode is on, the displayed range in the car increases a few miles or km. For all calculations, this chart uses range numbers with range mode on because this statement by Jerome Guillen: “EPA testing is [done] with range mode on, given that it is assumed customers will use that function when they want to drive the farthest.” In other words, because the range scores are achieved with range mode on, it is more accurate to do calculations based on range numbers when range mode is on. But users don’t have to turn on range mode just to read their 100% charged range. The chart will calculate that accurately. | |||||||
| A video showing how range mode effects displayed range | Youtube | ||||||
| ◘ A cycle is when multiple percentage charges add up to 100%. For example charging 5 times from 70% to 90% is 1 cycle. Professor Jeff Dahn who is an expert on Tesla batteries said the following when responding to a question by a Tesla owner: | |||||||
| Quote: “If you charge from 30% to 70% 150 times or from 10% to 70% 100 times, the ageing of the battery will be approximately the same”. | Source | ||||||
| A video of Prof Dahn comparing Model S battery to other EVs | Youtube | ||||||
| ◘ If you don’t see your name on cycles chart, go back to data entry and enter lifetime average energy consumption (Wh/km or Wh/mi). | |||||||
| Replacement Batteries | |||||||
| If you have a replacement battery, don’t be surprised if you don’t recognise the mileage and battery age numbers you see above. These numbers are calculated for your replacement battery. They are different than your car mileage or vehicle age. If you want to know more about how this calculation is done, read on. Otherwise this might be too much detail.
Let’s assume somebody entered this data: |
|||||||
| Mileage calculation for replacement battery: If the battery hadn’t been replaced, typical range would be 390-5= 385 km on the old battery at 30,000 km. If 30,000 km equals to 400-385 km range loss then X km equals to 400-390 km range loss Cross multiply. X= 30,000 * (400-390) / (400-385) = 30,000 * 10 / 15 = 20,000 km. The chart will display 20,000 km |
|||||||
| ◘ Why does the chart display 20,000 km even though actual mileage on the replacement battery is only 30,000-24,000= 6,000 km? Because this replacement battery was refurbished and had some mileage on it. ◘ Why does the chart display 20,000 km even though mileage on the car is 30,000 km? Because the chart displays mileage on the current battery not on the car and it has calculated that the replacement battery has 20,000 km mileage on it. ◘ How would the chart calculate age on the replacement battery? Age = 350 * (400-390) / (400-385) = 350 * 10 / 15 = 233 days |
|||||||
| ◘ What mileage would the chart show if the replacement battery still had 400 km range? Even though the calculation would result in zero miles (X= 30,000 * (400-400) / (400-395) = 30,000 * 0 / 5 = 0 km) the chart recognises that the calculation shouldn’t be less than what the user reported. In this case odometer shows 30,000, replacement happened at 24,000. Therefore mileage on the replacement battery is at least 6,000 km. Therefore the chart would display 6,000 km. The age calculation for the replacement battery would result in zero days too because the typical range is still 400 km (same as a new battery). Of course zero days would be incorrect too because the battery has 6000 km on it. Again the chart wouldn’t use zero and would calculate the time that corresponds to 6000 km mileage as follows: If 30,000 km equals to 350 days Then 6,000 km equals to X days X= 6,000*350/30,000= 70 days |
|||||||
| Updates | |||||||
| ◘ 30 July 2015: The Mileage Chart now switches between km and miles depending on location of selected username. We have now more entries from USA than before. So I thought this would be useful. Matteo | |||||||
| ◘ 11 Feb 2016: The trendline for the first chart (Mileage vs Remaining range chart) has been updated. The old trendline was a third order polynomial trendline. It worked fine for 0-120,000 km where there are lots of entries but after there were no more entries it showed a sharp drop. The new trendline is polynomial until the data ends but linear afterwards. Like the old trendline this new trendline is also calculated automatically by the chart and updates when there are new entries. Matteo | |||||||
| ◘ 9 Aug 2016: I added a script that clears the username selection in E1 every 2 hours. Matteo | |||||||

Leuk stukje Maarten!
Hierbij nog een link naar de interactieve grafiek die zo nu en dan geüpdatet zal worden met nieuwe data:
http://www.daglievemensen.nl/tesla/maxrange.htm
These numbers will not work as the 100% number can increase with several 100% charges in a row.
My car increased about 10km after three 100% charges in a row. Cells need balancing, so the only way to check max range is by doing several full charges combined with deep discharges. Only then can you balance the pack enough to get an indication of real degradation.
i agree, but it is the best we have, at least you could say that these numbers are a lower bound, i.e. the truth will always be better than these numbers!
In my car, the truth is much worse than the numbers. My 2016 90D battery capacity repeatedly calculates to 71 to 73 kwh. And it has a 200 mile maximum range. Despite attempts at very docile driving. Service rep says my battery is functioning normally.
The real deception is that the cars instruments continue to display the untrue range of 275 miles per 100% SOC.
I wouldn’t give up on this. My 85D (2015) still charges to 265 miles after 20k miles.
In reply to;
“My 85D still charges to 260 miles”.
But do you actually get 260 miles of range? How do you know that the predicted range is accurate? Or even close to reality? What algorithm does the vehicle computer use to calculate predicted range? What if predicted range is calculated from present voltage, some moving average for kWh per mile, and some constant for battery capacity? In that case, the battery would appear to never degrade.
I say this because this is how my 90D behaves. It displays 270 or 275 miles of range. But actual range is about 200 miles. And calculated battery capacity is repeatedly 70 to 74 kWh.
Thanks for sharing this document and graph. I will use this data with my service centre to justify my worst than average range loss.
Nice article, the only part that is missing in my opinion is that the capacity of the battery is affected by the ambient temperature. In the winter period the (EPA) is probably less than in the summer. At least that is my experience with the Renault Zoë and Nissan Leaf.
Range is definitely less in colder weather, but I doubt if it affects the calculation of the range (directly after charging) that much as the battery is heated because of the charing. When the battery cools down you will see a ‘loss’ of range caused by the dropping temperature of the battery.
I also made a visualization of the results colored with the average temperature for the day when the range charge was done. There doesn’t seem to be a strong relationship between the temperature and the maximum range above or below average: http://www.daglievemensen.nl/tesla/maxrange_temp.htm
Our results from the MisterGreen demo after 50.000 km in a P85, including a trip from 8.000 km from The Netherlands to North Cape while Supercharging 2 times per day during 10 days
Typical range 386 km = 3,5% degradation
Pingback: Model S batteriförsämring - Tesla Club Sweden
Thank you for this chart !
Very interesting !
But do you know the age of these batteries to separate the time effect and the cycling effect…
Or do you know the annual mileage distribution and what is the average yearly mileage done by these Tesla drivers ?
Yes, we have the delivery date of the cars and thus can calculate the yearly mileage.
In this graph the yearly mileage is plotted against the deviation from the trend line (describing battery percentage vs. mileage):
There doesn’t seem to be a correlation between both values.
If battery age would account for a significant loss of range, the red dots (negative deviation from trend line) would be found in the lower left and the green dots (positive deviation from trend line) would be found in the upper right, since cars with a high yearly mileage would then have an ‘advantage’ relative to cars with a low yearly mileage (losing their range because of age instead of mileage).
Also the ambient temperature (at the moment of range charging) doesn’t seem to correlate with the deviation from the trend line:

What is the source of the “range” data? From the cars display? This is thoroughly unreliable. The cars range display may be calculated using an assumed value for battery capacity.
Maarten, een erg interessant artikel. Misschien leuk om een keer een stukje te schrijven over hoe het opladen van elektrische auto’s werkt. Mijn ervaring verteld me dat hier in ieder geval veel ontwikkelingen in zijn. Ben nieuwsgierig of jij hier meer over weet.
Pingback: Battery Health Survey | TESLA OWNER
Beste Ton van den Berg,
Zie voor gestuurd en gepland laden
http://www.vdsijs.nl/laadpalen
Gekoppeld aan een intern smart grid.
Hartelijke groeten,
Wim de Leeuw
Pingback: Lithium Ion Technology | The Handleman Post
Pingback: Tesla Model S Battery Degradation Data
Does this take into consideration that the km remaining at 100% charge has been modified several times in software?
I know they’ve changed the calculation method at least once during the past 12 months, which resulted in an approx 5% drop in “perceived capacity”, but not “real capacity”.
i think they did not change the rated (EU) and ideal (USA) number, only the typical (EU) and rated (USA)
NB;
The Tesla guarantee is NOT against “normal” degradation, but only exceptional loss due to manufacturing defect. Nobody really knows what “normal” means, yet, for the TM battery packs.
Pingback: 40K Mile Statistics | TESLA OWNER
This goes a long way toward defining what is normal! Thanks much!
Pingback: 電気自動車のバッテリーの寿命ってどのくらい?交換できる? | EVsmartブログ
Hi. This is Teo. I created the charts above in the Merijn survey. In the article you said “replaced batterie cases are left out because their mileage is not known”. This is not correct. All replacement batteries are included and their mileage is calculated accurately. Not only is their mileage on this owners car considered but the mileage on the previous car is also calculated because most replacements are refurbished. All this is explained in great detail at the bottom of the charts page.
corrected, thx!
Why is the difference between typical rated range with Range Mode off and the correction that small (ca. 5 km for the S85 and 3,5 km for the S60)? Shouldn’t it be about 35-50 km?
Hi. Here is a video that shows the difference.
Thanks, does anybody know the difference in range daily charge and trip charge?
The terms daily charge and trip charge apply to Tesla Roadster but they don’t apply to the Model S because the Model S doesn’t have these buttons. In the video you see the green battery image. On bottom right of the green battery there is a white arrow. That is a slider. You can move that to 100%, 90%, or whatever percent you want.
Pingback: Vad kostar det egentligen att köra en #elbil som #Tesla? | Fredrik Leijerstam
Pingback: 6 Reasons The Tesla Model 3 Will Be A Huge Success | CleanTechnica
Pingback: 6 Reasons The Tesla Model 3 Will Be A Huge Success – Enjeux énergies et environnement
Pingback: 6 Reasons The Tesla Model 3 Will Be A Huge Success – CleanTechnica
Pingback: 6 Reasons The Tesla Model 3 Will Be A Huge Success
Pingback: Onze eerste 100.000 km elektrisch rijden | Steinbuch
Hi Steinbuch,
This is Matteo aka Teo. I’m the person who created the graphs in Merijn’s survey and I provide continuous technical support for this project on a volunteer basis using Google sheets. There are a few things you could change in your article if you want:
1) You could change this sentence:
“The way to measure is to do a range (full) charge (100%) and then check the typical (in the US this is called rated) or rated (in the US this is called ideal – NEDC) range.”
To this:
The way to measure this is to do a full charge (100%) and then check the EPA rated range (in North America) or Typical range (in Europe and Asia/Pacific).
Reason: In the survey we never use Ideal range or NEDC rated range. These two units are hardly used by Tesla owners because they are less realistic than the other two alternatives. In North America the car can display either EPA rated range or Ideal range, depending on what the user selects in the settings menu. Almost all Tesla owners use EPA rated range. Therefore we use that too for North America.
Everywhere else in the world the car displays either Typical range or NEDC rated range. NEDC rated range is overly optimistic and Typical range is very close to actual range. Therefore almost everybody uses Typical range. In the survey we use that too outside North America.
2) You could change this sentence:
“In the plot, these numbers are compared to the 0 km range data – for a 85kWh Model S this is about 400 km typical or 500 km rated (EPA).”
To this:
“In the plot, these numbers are then compared to the range numbers the car displayed when it was new. For example, for the 85 kWh Model S85 variant, this is about 400 km typical range or 265 mi EPA rated range.”
3) You could change this section:
“Update: June 7, 2016. Tesla Motors gives an 8 year infinite miles battery guarantee. Nevertheless, it is highly relevant …”
To this:
“Update: June 7, 2016. Tesla Motors provides an 8-year infinite mile battery failure warranty but it doesn’t cover degradation. Therefore it is highly relevant …”
4) You could drop the following sentence:
“Do not put too much attention to the automatically generated polynomial fit (red line).”
Reason: The red line that you see is not an automatically created polynomial trendline. Polynomial trendlines that Google sheets creates would not fit accurately. Therefore for the first two charts a special trendline was added that is half polynomial, half linear. The trendline starts curved and then changes to linear midway through. Creating this trendline slows down the file slightly therefore the other charts don’t have this special trendline. They used to the regular polynomial trendline but I removed those because people were paying too much attention to the inaccurate automated trendlines.
top, thx, corrected it all!
The only way to make this data useful is to use actual range data (very difficult to obtain for large n), rather than the cars display of range. The cars display of range may be calculated using a formula that uses a constant for battery capacity. If true, the batteries will appear to never degrade.
Peter, Do you have a source of actual range data?
Re; a source for actual range data.
Only for my car. The cars trip data which shows kwh used divided by the display of battery percentage used is the capacity of the battery. While this value is likely inaccurate for short trips, it should be fairly accurate for trips that consume most of the batteries capacity.
It would be very interesting if a large number of owners would do this. I would love to know if my calculated battery capacity is uniquely poor. Or others have this problem as well. My battery capacity is about 72 kWh for a nominal capacity of 90 kwh
Hi Steinbuch,
This is Matteo. I have some feedback. You could change the following sections in your article if you want. Thanks
1) You could change this sentence:
“Although there is uncertainty because of the range estimation, as well as because of the state of the battery (balanced or not), the rated (US: ideal) measure is seen as the most reliable, especially if before the range charge the battery was almost empty.”
To this:
Even though this is mostly a reliable method, sometimes the computer in the car can’t accurately estimate how much energy the battery holds and might display an inaccurate range number. To improve accuracy, it is a good idea to run down the battery to almost empty and then charge to 100%, once a month. This is known as rebalancing the battery. However, the battery shouldn’t be left at 0% or 100% for more than 2 hours.
2) You could change this sentence:
“Merijn (Matteo also known as Teo) also plotted the degradation as a function of age and of milages, see below.”
To this:
Besides Mileage vs Remaining Range, the file includes two other charts: Charge Cycles vs Remaining Range and Battery Age vs Remaining Range.
Using the cars calculated total range from 100% full charge seems troublesome unless you know how that number is calculated. For example, it is possible that the number is calculated by dividing the rated kWh capacity of the battery by some long term average kWh per mile. If this is true, battery degradation will never be discovered. It will only reveal long term changes in energy consumption per mile.
The car offers a much better way to calculate battery capacity. On the Trip page, a value for energy used since last charged is displayed. If you divide that by the change in state of charge, you have a direct measure of battery capacity. For example: If that page shows that you used 40 kWh since last charged, and your state of charge went from 80% to 30%, then the total capacity of the battery is 40 divided by 50%, or 80 kWh. Of course this calculation will be better the longer the trip, it seems like the best way to estimate/calculate battery capacity.
Peter Lucas
Pingback: My personal review of Tesla 2016 | Steinbuch
Pingback: Test test test – Site Title
A bit related: https://www.elektormagazine.com/news/80-price-drop-in-ev-batteries
Thanks for the effort Maarten. I hope insurance companies look as well so they have more trust in EVs.
What is the electrochemical reason for the trendline to drop steeper after 200K+ kilometers. And do you also see/expect changes in the charging cycle efficiency?
This is one of the reasons why Tesla is more a fan of recycling comapred to 2nd usage.
Hi, Jorg. The reason the trendline drops sharply after 200,000 km is because there are not many entries after this mileage. In fact, all 3 entries after 200,000 km belong to the same user and by chance, those happen to be lower than average. If there were entries by multiple users, the trendline would be smoother.
The 2170 cells the Model 3 will use, have a different chemistry than the current 18650 Tesla cells. We might see some changes. Check back again a few months after the Model 3 release and hopefully, we will have enough data to start comparing the Model S trendline to the Model 3 trendline.
If those charts are created from the cars display of range, then the entire presentation is false. The cars displayed range appears to be completely unaffected by battery degradation. In fact, the calculation appears to assume the the nominal, original value for battery capacity, then divides that by some value for WH/mile.
To find the actual energy capacity requires a little arithmetic using other displayed values. Here is how:
1) As you set off on a trip, note the State Of Charge of the battery, in %. Hypothetically lets say 80%.
2) At the end of the trip (no charging in between), note the battery SOC. Lets say hypothetically, 30%.
3) Go into the Settings menu, then Trips. One entry will be “Since last charge”. There will be miles, Wh/mile, and importantly kWh used since last charge. Let’s say 37 kWh. Now you do the arithmetic. Very simple really. You take the change in SOC and divide that into the kWh used. So in this case, the change in SOC is 80% minus 30%. That is 50%. 50 percent is actually 0.5. So 37 kWh divided by 0.5 is 74 kWh. This passes the common sense test; if half of the battery capacity provided 37 kWh. Then all of the battery capacity must be 74 kWh. This, by the way, is exactly how my 2016 90D behaves. In modest temperatures and modest driving. And tech supports reviewed everything and said it is normal.
Now. We know that the cars measurements of SOC and kWh used are not exact. And there is some buffer at the top and bottom of the battery capacity. But these should not repeatedly yield a battery capacity of 72 rather than 90 kWh.
Very nice, thanks! Do you have higher resolution versions of the first 2 graphs?
I got them from the original link, you can do that too
Here you go:


Every part of this data and conclusions relies on a single completely unreliable assumption: That the displayed range by your cars instrumentation is accurate, or nearly accurate. If it is not accurate, every conclusion about battery degradation is wrong. The stated range from your car may be very far from true. Mine surely is. My 2016 90D continues to show a 100% range of about 270 miles. Yet my battery has degraded to hold only 70-73 kWh. And my best attainable range is about 200 miles. A service center rep pulled the vehicle logs and told me that my car and battery are performing normally.
How do I know, and how can you know, what the real battery capacity is? The instruments display the key piece of information on the “Trips” page. There you will find “kWh used since last charge”. If you compare that to the change of state of charge since you last charged, you can easily calculate your battery capacity in kWh. Here is an example: I start with the battery at 80% charged. After driving, the state of charge is 30%. So I have used 50% of the battery’s capacity. The trip display shows that during this time I have used 35.1 kWh. The total capacity of the battery must therefore be 70.2 kWh. The general formula is: Battery capacity is Trip kWh divided by change of state of charge. The change of state of charge must be as a fraction, not a percentage. So if the state of charge goes from 80% to 30%, the change is 50%. 50% is 0.5.
Caveats and comments:
1) The actual battery capacity is a bit larger than calculated due to the empty safety buffer. And possibly a buffer at the top end too. That is, when the remaining capacity displayed is “0”, you actually have a little battery capacity remaining.
2) A service rep told me that the energy consumed to maintain battery temperature is not recorded by the trip display. So if the ambient temperature is far from the battery temperature set point, hot or cold, the apparent battery capacity will be less. On my car, I found a greatly reduced battery capacity even when the ambient temperature was consistently mild. In fact, the 70 kWh calculated battery capacity did not change much from very hot summer months to mild winter months.
3) An aggressive vs. gentle driving style can have a huge effect on range. I have seen this. But it should have no effect on measured battery capacity. And using the method described, battery capacity has been remarkably consistent over the 7 months of ownership.
Peter Lucas
Peter, your method of calculating your actual battery capacity is also based on assumptions. You assume that the % battery indicator is correct (e.g. you’ve assumed you really have used 50% of the battery in the example above) – but this may not be correct, since Tesla may choose to non-linearise their display of battery capacity to make it appear better than it really is or to make the bottom part of the SOC appear to last a little longer than the top part. In fact, it wouldn’t be surprising if Tesla allow slightly more battery to be used than they indicate – to help protect people running out of battery capacity. And customers will be less concerned about an apparently more rapid loss of energy at the beginning of the journey than at the end.
If in your example you had only used from 78% to 33% (real capacity, not indicated) then your true battery capacity would be 78 kWh.
But even this calculation is based on an assumption – that the used energy is 35.1 kWh. Again, we might expect Tesla to underestimate the amount of energy that has been used on the trip (in order to make the vehicle appear slightly more efficient). If the true usage had been 36.5 kWh then your total battery capacity would actually be 81.1 kWh. Jason Hughes has discovered that Tesla’s own calculation of the usable capacity for a 90D is only 81.8 kWh. https://electrek.co/2016/12/14/tesla-battery-capacity/
When you state that you can only drive 200 miles this depends on several factors (which I’m sure you understand, so I’m not trying to ‘talk down’ to you):-
1. Driving style (especially high speed)
2. Extreme ambient temperatures (+30 deg C)
3. Altitude change
4. Vehicle loading (mass, tyre pressure, roof racks etc)
5. Remaining range. (i.e. you say ‘200’ but how much is remaining in the battery when you finish? So the range capability would simplistically be ‘200 plus remaining range’.
On this last point I have trawled the web and found over 20 verbatim reports (some with video evidence) suggesting that a Model S achieves anything between 75 and 115% of the stated EPA range, when driven in the real world by a variety of customers in a variety of conditions. I can also say the average is 90% of the EPA range.
Ultimately we cannot get real numbers without dyno testing and carefully measuring the work done by the vehicle.
Tim: It is possible that the bottom of the SOC gauge is compressed. For example, when the displayed SOC is 40%, there could be 50% of capacity remaining. That would account for an apparently smaller battery capacity when looking only at the upper part of the SOC scale. But until charging stations are much closer together, exploring the size of the bottom of the SOC scale is risky.
Even the method of extrapolating full battery capacity from a partial discharge cannot be trusted. This method assume that the percentage display is linear and accurate.
I would treat it as the gas gauge in an ICE car. Many of us have see the behavior where the gauge stays near “full” for a long time and then drops rapidly.
I would say the better way is to do a nearly full discharge, from 100% until the car is as close to zero as you dare to get. Extrapolate that, not merely 50%, and you will get a more accurate estimate of usable capacity.
Michael Hirsch: I completely agree that estimating the range of a complete charge is better when extrapolating from the largest portion of a full charge as possible.
My point was, and is, that the car’s display of range may be very far from the actual range obtainable under normal driving conditions. In my case, on my 2016 90D, the actual range is about 200 miles. Much less (about 27% less) than the 275 miles displayed.
Among the implications of this is that all of the graphs and charts published by the earnest Mr. Steinbuch are likely hugely inaccurate.
Pingback: What is the Lifespan of a Tesla Battery and How Long Will it Last? | Teslanomics
Pingback: Teslanomics Examines Tesla Battery Degradation: Interactive Owner Spreadsheet Shows Results
Pingback: Tesla Model S battery life: what the data show so far - Trigger Energy
Pingback: How Long Will A Tesla, LEAF, Or Other EV Battery Last?
Pingback: New top story on Hacker News: Tesla Model S battery degradation data – The Internet Yard
Pingback: Tesla Model S battery degradation data | ExtendTree
What’s the degradation on a typical ICE? Fuel economy isn’t constant over the life of those engines, either, while the tank size is. Carmakers don’t offer warranties on degradation of ICE fuel economy.
So this seems like good news for EVs, but I have no basis for saying if this is better or worse than my old 4-stroke in the garage.
Pingback: Tesla battery predicted to have 80% capacity after 840,000 km (521,000 mi) - Stocks Masters
Pingback: Исследование показало, на сколько деградирует батарея Tesla после 840 000 км пробега | Autogeek
Pingback: Tesla Model S のバッテリー寿命が長いというデータについて | ゴルディアスの涙目
Pingback: Sí, las baterías de los coches eléctricos pierden capacidad con el paso del tiempo, pero eso no es ningún problema en Denki
Pingback: 25 万公里衰减不到 10%,买了特斯拉可以放心开 | TechNews 科技新报
Pingback: 開了 25 萬公里後電池衰減不到 10%,特斯拉車主可放膽開了 | TechNews 科技新報
Pingback: SÍ, LAS BATERÍAS DE LOS COCHES ELÉCTRICOS PIERDEN CAPACIDAD CON EL PASO DEL TIEMPO, PERO ESO NO ES NINGÚN PROBLEMA – sc247
Pingback: Data Suggests Tesla Battery Packs Will Retain 80% Capacity At 521,000 Miles
Pingback: Un registro de usuarios apunta a que las baterías Tesla mantienen el 80% de capacidad tras 840.000 kilómetros
Pingback: Samsung Challenges Tesla for EV Battery Dominance – Will it Matter? – Teslanomics Live Sept 18, 2017 | Samsung Mobile
Pingback: Estudio indica que la batería de un Tesla Model S sólo perderá un 20% de su capacidad de carga tras 840.000 Km en Denki
Pingback: Tesla Batteries Last Forever (Basically) – Teslanomics
Pingback: What is the Lifespan of a Tesla Battery and How Long Will it Last? – Teslanomics
Wow! I am jealous. We’ve lost 5% of capacity per year on our Model S 60. Pretty depressing.
All of this data assumes that the Tesla’s display of range is accurate.
It isn’t.
My 2016 90D has displayed a full charge range of about 275 miles since day one. My actual range, normal driving conditions, is about 200 miles. This is hugely different.
To me, it looks like the cars calculation of range assumes that there has been no battery degradation. State of charge times nominal battery capacity divided by watt hours per mile.
So is this all bullshit?
I think the entire study is useless as designed because it relies on the cars display of range. I ran a 100% to 10% test on my car (2016 S 90D). The “fuel gauge” (battery % display) is very linear with respect to both kWh used and distance traveled. This validates my previous assumptions that maximum battery capacity can be determined, extrapolated, from partial consumption of battery capacity. And that the cars display of range may be complete fiction.
To find your actual total available battery capacity: Divide kWh used by battery percent used. For example: if you used 36 kWh and the battery gauge went from 80% to 30%, then your total battery capacity is 36/0.5 which is 72 kWh. This is typical for my car. While at the same time, my car displays a fully charged range of 275 miles. The benefit of this method of calculating battery capacity (aside from its accuracy) is that the efficiency of your driving style is irrelevant,
Some Cell-Tests:
https://www.researchgate.net/publication/319136340_An_in-depth_view_into_the_Tesla_Model_S_module_Part_one_Single_cell_testing_and_modelling
Pingback: Tesla the Brand – Site Title
Pingback: 4 Jahre ZOE - Elektroauto Renault ZOE - Elektromobilität im Alltag
Pingback: Исследование: износ батарей Tesla составит всего 20% при пробеге 840 тыс км — МИР ВОКРУГ
Pingback: Electric shock – Piekniewski's blog
Pingback: Tesla’s Model 3: Unprecedented Price Performance Means Unprecedented Sales | Tesla Motors
Pingback: Tesla's Model 3: Unprecedented Price Performance Means Unprecedented Sales - Cloud Computing Blog
Pingback: Tesla's Model 3: Unprecedented Price Performance Means Unprecedented Sales - Cloud hosting Blog
Pingback: Elektroautoguru #4 – Wie haltbar ist eine Elektroauto Batterie und wie teuer wäre ein Austausch? [Video] | DanZei
Pingback: Tesla’s 850,000 mile battery – Commercial Solar Guy
Pingback: Batterie Tesla: 270mila km, 9% di degrado | Tesla Club Italy
Pingback: 25万7千キロ走っても、テスラのバッテリー劣化は10%以下 | EVsmartブログ
Pingback: Let's Look At Tesla Model S & X Battery Degradation
Pingback: Seven reasons why the Internal Combustion Engine is a dead man walking – Tom Raftery's Internet of Things
Pingback: Seven reasons why the Internal Combustion Engine is a dead man walking - Enterprise Irregulars
Pingback: Vehículos eléctricos y desinformación | Que es Google - Técnicas de posicionamiento Web SEO
Pingback: Vehículos eléctricos y desinformación - Ofixcomp
Pingback: Electric Vehicles And Disinformation – Kopitiam Bot
Pingback: How Long Will EV Batteries Last? | Tesla Co-Pilot Manual
Pingback: ELECTRIC VEHICLES: Big EV boost, No license needed to set up charging stations, Battery study scripts the end of fossil fuel cars, Chinese Island forced to ban gasoline cars – Carboncopy Making Climate Sense
Pingback: Seven Reasons Why The Internal Combustion Engine Is A Dead Man Walking [Updated] | Conservativespeech.com
Pingback: Seven Reasons Why The Internal Combustion Engine Is A Dead Man Walking [Updated] | Media One
Pingback: Seven Reasons Why The Internal Combustion Engine Is A Dead Man Walking [Updated] | Capmocracy.com
Pingback: Seven Reasons Why The Internal Combustion Engine Is A Dead Man Walking [Updated] | loyalchristian.com
Pingback: Seven Reasons Why The Internal Combustion Engine Is A Dead Man Walking [Updated] | WorldAsia.tv
Pingback: Seven Reasons Why The Internal Combustion Engine Is A Dead Man Walking [Updated] | Anaptiras.com
Pingback: Seven Reasons Why The Internal Combustion Engine Is A Dead Man Walking [Updated] - Extra News Today
Pingback: Seven Reasons Why The Internal Combustion Engine Is A Dead Man Walking [Updated] | Usworldnewstoday.com
Pingback: Seven Reasons Why The Internal Combustion Engine Is A Dead Man Walking [Updated] | Newsmediaone.com !
Pingback: Seven Reasons Why The Internal Combustion Engine Is A Dead Man Walking [Updated] - World Media
Pingback: Seven Reasons Why The Internal Combustion Engine Is A Dead Man Walking [Updated] | survivalisthandbook.com
Pingback: Seven Reasons Why The Internal Combustion Engine Is A Dead Man Walking [Updated] | Wespeakupnews.com
Pingback: Seven Reasons Why The Internal Combustion Engine Is A Dead Man Walking [Updated] | righteouspatriot.com
Pingback: Seven Reasons Why The Internal Combustion Engine Is A Dead Man Walking [Updated] | BKKNews.org
Pingback: Seven Reasons Why The Internal Combustion Engine Is A Dead Man Walking [Updated] | SPOT TIMES
Pingback: Seven Reasons Why The Internal Combustion Engine Is A Dead Man Walking [Updated] | Lifenews.life
Pingback: Seven Reasons Why The Internal Combustion Engine Is A Dead Man Walking [Updated] | Gunsandammonews.com
Pingback: SAP BrandVoice: Seven Reasons Why The Internal Combustion Engine Is A Dead Man Walking [Updated] | StockTalk Journal
Pingback: Seven Reasons Why The Internal Combustion Engine Is A Dead Man Walking [Updated] | theinformationsuperhighway.org
Pingback: The Misinformation Around Electric Vehicles – Vunela
Pingback: Tips To Increase Your Mobile Battery Lifespan || Unknown Facts || Telugu || by prakash. | EZ Battery Reconditioning
Pingback: The Best Tesla Batteries Last Forever (Basically) Coupon Discount Promotional Codes Reviews 2019 | The best products item searching online
Pingback: Correcting misinformation about greenhouse gas emissions of electric vehicles: Auke Hoekstra's response to Damien Ernst's calculations - Innovation Origins - DLIT
Pingback: テスラを買うなら中古のモデルSが狙い目! | EV lave
Pingback: Tesla Batteries Last Forever (Basically) – HEALTHY ENVIRONMENTS, A DIV. OF CYBERMARK SOLUTIONS
Pingback: Tesla Batteries Last Forever (Basically) – alternativeenergy
Pingback: Ola to launch 10,000 EVs in 12 months | CarbonCopy
Pingback: Tesla Batteries Last Forever (Basically) - scoreit.online
Pingback: Tesla Batteries Last Forever (Basically) – Eden-E-Motion
Pingback: Fraunhofer ISE was wrong: hydrogen cars are not cleaner than battery-driven electric vehicles and diesel cars are not even close – Electric Vehicle Batteries
Pingback: テスラ Tesla バッテリー75個目
Pingback: Tesla Batteries Last Forever (Basically) – Tuts Ninja
Pingback: テスラ Tesla バッテリー75個目 | にゅーすくろすと
Pingback: ÖAMTC, ADAC, Fraunhofer ISE & IFO – are all spreading misinformation on electric vehicles: What’s going on here? – Electric Vehicle Batteries
Pingback: Tesla S: Confira 11 Características Sobre Esse Famoso Sedã Elétrico – Amando Carros Mais Uma Vez
Pingback: Tesla S: Confira 11 Características Sobre Esse Famoso Sedã Elétrico – Mecanico Murilo
Pingback: Kaufberatung gebrauchter Tesla – Oder wie man die Batterie beim Tesla auslesen kann – Tesla Model X Erfahrungsbericht
Pingback: » Zkušenosti s Hyundai Kona Electric, aneb to elektroauta mohou za vaše posraný životy » NotebookBlog / Postřehy a zkušenosti ze světa mobilní techniky
Pingback: 4 Easy Steps to Spot Greenwashing - Bellona.org
Pingback: Samochód elektryczny w firmie – czy warto się już przesiąść? ✅ MIT Sloan Management Review Polska
Pingback: Im Schnitt gut 90% Kapazität nach 280.000 km > teslamag.de - eMobility Stammtisch München
Pingback: Nuevos datos sobre la degradación de las baterías de Tesla | forococheselectricos
Pingback: Dienstag Kompakt: 5 tolle Solarstromer, Batterie-Degradation nach 400.000 Kilometern, VW investiert, wer ist eigentlich carl? - e-engine - Alles rund um E-Mobilität
Pingback: #StackBounty: #distributions #stochastic-processes #nonlinear-regression What distribution may electric vehicle battery capacity data f… – TechUtils.in
Pingback: Elektromobilität für eine nachhaltige Verkehrswende? - FFF Duisburg
Pingback: How Many Miles Can A Tesla Last? - teslatoro.com
Pingback: Onze Vijfde Tesla en Vijf Tips voor nieuwe Tesla Rijders | Steinbuch